Tag Archive: process map

Process Mapping? I’d rather be Napping.

So I’ve heard a lot of people say they are so fascinated by what I do in the process improvement world, and how great they think it is , but how “it’s not for them”.  Using my coaching skills, I usually say something like, “Oh yeah?  Tell me about why it isn’t for you”.

Here are some of the responses I get:images

“Snore.  Processes are super boring. My company is really intuitive, and we just know exactly what to do and we fix it.” – my super annoying friend

“Processes, who needs it? I already know my team is garbage and as soon as I can replace them, things will turn around”. – a client who later realized her team was great because process mapping revealed a culture issue

“Ugh.  Sounds bureaucratic. I’m an entrepreneur.  There is nothing corporate about he way I run my business, and to be honest we don’t need it.” – my sister-in-law

PROCESS MAPPING3 Signs You Need Process Mapping STAT!

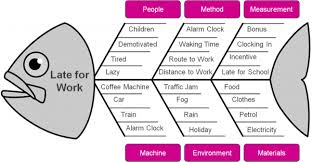
  1. Something is wrong and you “think” know exactly how to fix it.  How do you know what’s wrong?  What leads you to believe that?  What is the expected outcome if you make the change? You might be right. Intuition is super important.  Why not validate those gut feelings with some evidence in a process map? It’s a great way to get buy in from your stakeholders and employees!
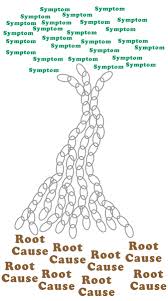
  2. You “think” your employees are the problem. They suck.  While this is the first place many people look for solutions, it’s usually something else.  Why do you think they suck?  What tells you that? What could be inhibiting them? Have you asked them? Research shows that if you take great people and put them in a bad process, the process will win every time. Process mapping sometimes uncovers secrets that are hiding within a bad process.
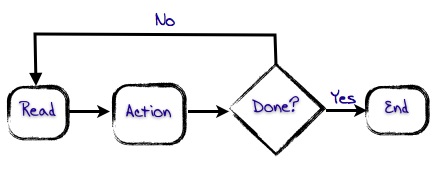
  3. You “think” process is too rigorous.  Well, it can be, but it doesn’t have to be.  The right people, the right style, and the right moment can take you from being a fly-by-the-seat-of-your-pants entrepreneur to a being a strategic one.  Why not set the stage so you can pass the tasks that aren’t worth your time (or you aren’t great at) to someone who can actually add value (so you can go and be amazing). Process mapping identifies those tasks and lets you properly divide them up.

If you’re not a “process person,” or even if you are but don’t have a lot of time, we can help you. We are expert at coming in, talking with you and your team, and uncovering the hidden opportunities to improve your business.

Even better – why not build process improvement and process mapping capacity on your team? We offer public workshops that are fun, interactive, and relevant. Check them out by clicking here, and contact us if you want to know more.

#whiteboardworskhops #theyredifferent

Until Next Time,

Nicole

Screen Shot 2016-06-16 at 4.09.44 PM

Whiteboard Workshop: Introduction to Process Mapping

pm
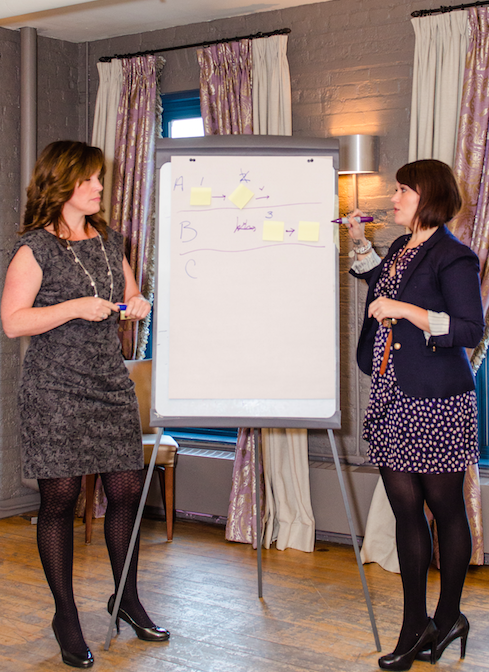
Process Mapping is awesome and fun and helpful and easy and so amazing, right?

No? If you disagree, you’re not alone. We did a quick Twitter poll and asked people what their thoughts are about Process Mapping. Here are some of the replies:

  • Process mapping? More like process napping! (Click to Tweet!)
  • Process mapping is critical, in that if you don’t do it, you can save the rain forest, your time, and your sanity.
  • Who needs sleeping pills when you could participate in a process mapping session?
  • Process mapping is the paleo of the workplace. (Click to Tweet!)
  • AT FIRST GLANCE THEY ARE SO INTIMIDATING AND COMPLICATED (this one was complete with caps)

So yeah. We get it. There are a LOT of people who don’t like process maps.

At least they think they don’t – they just haven’t met us yet.

But I “Need” to Do Process Mapping

Despite how people may feel about process mapping, they still need to use them. Either they have to design them on their own, or read some that have been designed by someone else. Some people know the “why” behind process mapping but still haven’t quite mastered it, and others have no idea what they are doing or why, only that “they have to do this for audit purposes.”

The truth is that process maps are necessary and critical in so many situations:

  • Training new people,
  • Documenting processes for audits,
  • Understanding the flow of information in an organization,
  • Having a picture of how customers are impacted by business processes,
  • Identifying areas to improve,
  • Identifying areas that are excelling (and should be modelled), and
  • Imagining a future state organizational structure.

So if you, or someone you know needs to do any of these things (or is responsible for others who are), then our latest workshop is for you. Read on.

1Whiteboard Workshop: Introduction to Process Mapping

If you have been reading our blogs for a while, then you know we love to make processes better, and we loathe things that are over-complicated. It follows then, that we don’t do process mapping (or training, for that matter), like most organizations do.

Our latest workshop, Introduction to Process Mapping, was first delivered on May 26th, and was a great success. Some testimonials:

  • I have done process mapping in the past, but it has been a long time since I’ve been able to utilize those skills. I was so happy to attend and receive a great refresher. Thank you!
  • There was a wide variety of different folks with different backgrounds, and you did great to keep all levels engaged and interested.
  • This course came at the perfect time! Something I really liked was the actual process mapping we did as individuals – it helped me demonstrate what I learned from the course.
  • I loved your banter – so funny and yet still professional. (This was our favourite, because we think we are very funny.)

We have two more dates set this fall. Both are Thursdays, and both will be in downtown Toronto (location TBD based on the group).

People who attend this course will be able to

  1. Understand the basics of process mapping theory and activities,
  2. Articulate the value of process consistency and when it can be “too much” (too rigorous),
  3. Demonstrate the ability to facilitate and develop a process map, and use appropriate levels, tools, and concepts (incl basics of Visio), and
  4. Analyze process maps to identify improvement opportunities.

You should come. You really should. CLICK HERE TO REGISTER. And if you have any questions, shoot us a note or Tweet us @whiteboardcons #ILOVEPM.

See you soon,

Ruth.


After Leading Process Change….

Did you miss us?  Ruth and I were saying that this is probably the longest we haven’t blogged. Don’t worry, we are back and in full force now!

In today’s blog I wanted to share some highlights of our 2-day course, “Leading Process Change,” which we delivered on November 5 & 6. We had a a great diverse group of participants, from the Ontario Government, Telus, Blackberry, and two web development firms, just to name a few.  It was a total blast.  We shared our experiences in change and leadership and learned basic process improvement skills too.

Day 1

Screen Shot 2014-11-28 at 9.03.23 AM

On day 1 we whizzed through the Whiteboard Way. It was a lot of material to cover, and using a business case, we helped our team of participants to:

1. Define It – Define a specific problem in an organization, without assumptions, without solutions, and using specific data to isolate the issue.

2. Draw It – Use basic process mapping techniques to visually represent a process clearly.

3. Analyze It – Look for opportunities to improve (like bottlenecks, duplication, and roles & responsibility conflicts).

4. Imagine It – Imagine a future state using brainstorming techniques.

5. Prove It – Use data to ensure that the new process performs better than the original process.

6. Sell It – Use excellent communications and stakeholder engagement skills to ensure that the process change is communicated effectively.


Day 2

On day 2 we covered a wide range of leadership topics to help participants learn how to guide a change – from embedding process improvement within strategic plans, to using emotional intelligence to increase people’s buy-in, and even how public relations plays a role (care of our excellent guest speakers)! And as well we covered basic communication, relationship building, and change management skills too!

We were really pleased to get some great feedback from participants:

“Love it. I will definitely bring the knowledge back.”

“Great back and forth engagement.”

“Great idea to combine change (of any kind!) with leadership —> practical tools & advice in simple, accessible language. Love it.”

Now it’s on to new and exciting projects to come….what do you want to learn next?

Let us know on Twitter @whiteboardcons!

*Special thanks to our awesome photographer Sara Beasley @Sarabeesphotography, www.sarabeesphotography.com

Until Next Time,

Nicole


Getting to the Root of It

root causeNicole and I have stumbled into a bit of a theme these days, talking about the basic activities involved in Process Improvement and sharing with you some user-friendly and simple templates. First, we wrote about how to actually map a process, and next we covered how to look at that process map and assess which steps are a waste of effort – i.e., they add no value. Both those blog posts include handy templates which you can edit and manipulate to suit your needs.

So now what?

In Nicole’s example, we learned that External Failures were taking 56% of the total time involved in completing a process. Since External Failures are clearly non-value-add steps, that is where we will focus. It may seem obvious, but often it’s over-looked so I’ll say it again: start your process improvement work on the steps that offer the most efficiency opportunities.

The next step then, is to look closely at the External Failures and think about what might be some root causes for them. By reducing or eliminating them, not only will we reduce the chance of upsetting a customer, but we will reduce the amount of time it takes to complete the overall time to do the process.

Root What Now?

Root cause. The main thing that is causing a process to fail. Here’s an example: a customer’s dessert arrives and it is burnt. What might the root cause be for that? There may be a few of them, so let’s brainstorm. The customer received the burnt cake because:

  • the server wasn’t paying attention
  • the oven was too hot
  • the recipe was wrong
  • the chef wasn’t watching the oven
  • the oven timer was broken

There are a few examples of why the cake might be burnt. Are they root causes? Nope. They are sub-causes. Let’s dig deeper:

  • the server wasn’t paying attention because:
    • he/she was rushing
  • the oven was too hot because:
    • the thermostat was broken
  • the recipe was wrong because:
    • the chef made it from memory
  • the chef wasn’t watching the oven because:
    • he/she was receiving an order of fresh vegetables during dinner service
  • the oven timer was broken because:
    • it hasn’t had any maintenance in 5 years

So are those root causes? Maybe. Let’s take a look:

  • the server wasn’t paying attention because:
    • he/she was rushing because:
      • three servers called in sick and there was no backup plan
  • the oven was too hot because:
    • the thermostat was broken
  • the recipe was wrong because:
    • the chef made it from memory because:
      • he/she learned it from someone else who didn’t write it down
  • the chef wasn’t watching the oven because:
    • he/she was receiving an order of fresh vegetables during dinner service because
      • the delivery truck was late
  • the oven timer was broken because:
    • it hasn’t had any maintenance in 5 years

Brainstorming with Fish

We’re getting closer. We have a few root causes in there now, and a couple of others might even be able to go further. A great way to do brainstorming like this is to think in terms of categories of what could possibly go wrong. You can use whatever categories will work for you or your business, but some common ones include:

  1. Equipment
  2. Process
  3. People
  4. Materials
  5. Environment
  6. Management

fishbone
A tool we love to use originated in Japan in the ’60s. Known by several names (Ishikawa diagram, Cause-and-Effect diagram, and Herringbone diagram, to name a few), we use the most common title – the Fishbone Diagram. This diagram is nothing more than a brainstorming tool that helps groups think about potential root causes of a problem or issue. Lucky for you, click on this Fishbone Template for you to use in your next brainstorming session. It will download automatically.

Here are the steps in using it:

  1. At the “head” of the fish, write the problem you want to address.
  2. At the end of each of the “bones” of the fish, write the categories you’d like to use. (Whichever ones will stimulate the best discussion.)
  3. You can start brainstorming sessions several ways. One we like to use is to give everyone a stack of sticky notes and a pen. Ask them to look at the categories and write down as many potential causes as they can – one per sticky note. Now have everyone put their sticky notes on the wall, clustered in the six categories. Discuss and add more (because people always think of more). Remove duplicates.
  4. Draw a line towards each “bone” and write the potential cause on it.
  5. Ask if there are any further “bones” that might go off of the one you just wrote. If there are, then draw a line connected to that line.
  6. Keep going until you’ve written down all the ideas, and then ask if there are any more.
  7. Done!

Now you have a big list of ideas, and the trick is to figure out which one of those is the most impactful. How do you know which one(s) to fix first? Well, Nicole will tell you that next week… so stay tuned!

Until next week,

Ruth

PS – details on our new course, Leading Process Change, are coming within the next few days. Stay tuned to our Twitter (@whiteboardcons) and Facebook feeds, not to mention our website.

How To Solve The Biggest Problems With Process Mapping

Post-Process Mapping

A few weeks back Ruth blogged about how to do a basic process map (click here to check it out) and it included a free process template for you to use as well. You’re welcome.  Process mapping is a huge part of our business. We know process mapping creates engagement and buy-in for process change  (when done in a workshop setting) , is a great visual tool, and can improve effectiveness and efficiency.

whiteboardconsulting.ca/staging: Peacocks and ProcessesRuth talked about the key steps in documenting a process; the steps include:

  1. Determine the swimlanes
  2. Determine the trigger point
  3. Consider the end point
  4. Put a circle shape in the swimlane for the person/group that starts things off. Write the word “START” in it.
  5. Put a square shape next to the circle and label it #1, and write the step.
  6. Proceed with each consecutive step.
  7. Add the arrows last (you almost always have to change them as you go).
  8. When you reach the end point, put a circle with the word “END” in it.

AND, I can’t believe Ruth forgot this.  I am going to gloat since she is a stickler for this one.

9. NUMBER your steps (post-production comment from Ruth – I am mortified! I can NOT BELIEVE I forgot that… and is such a public way! I will never live it down. Sigh.)

We received a lot of really good feedback on this blog, and people loved the template.  The big question was:

What do I do next, after the Process Map?what-next

Great question.  The next 2 steps are to validate your process map and look at value added steps.

Validation

So if you’ve done your process map in a workshop style setting, you likely had many of the stakeholders (the swimlanes) of the process in the room.  So validation in this case is finalizing that process map and sending it back out to those participants to see if what you’ve documented is accurate.

If you’ve worked on a process map by yourself,  validation becomes even more important. You are verifying that all the steps are accurate and represented properly. In fact, this is an opportune time to re-group and re-engage to validate the map, or engage for the first time.  A few things to keep in mind:

  • Talk to the people in the process and follow the product or service through the service to make sure steps and swimlanes have been captured accurately.
  • Make sure to capture easily seen or invisible steps (i.e. where the product or service is waiting, or being moved to another area)
  • Ensure that you haven’t mapped the best case scenario, or worst case scenario.  The map should be representative of how the process normally works.

Now for the meaty stuff….

Next we are going to analyze the process! First let’s determine whether a step adds value or not? Ask these 3 questions:

  1. Does the customer consider this step important?
  2. Has the product or service had a physical change?
  3. Was it done right the first time?

Here you can identify the type of non-value added activities. Non-value added activities include:value-added-non-value-added

  • Moves: Steps in the process where the product or service is in transit from one place to another. How many times and to how many people in your organization does this touch?
  • Delays: Steps in the process where the product of service is waiting for the next step in the process (a great example of this is approvals or sign-offs). This is your classic bottleneck.  
  • Set-up: Steps in the process that prepare the product or services for a future step
  • Internal Failures: Steps that have to be re-done (i.e. iterations of something before it reaches final approval) that are detected internally
  • External Failures: Steps that have to be re-done that are detected by the customer (i.e. damaged product at shipping….)
  • Control/inspection: Steps where the product or services is reviewed to ensure customer satisfaction (i.e. Quality Control)
  • Value Enabling: Steps that don’t add value but are necessary for the functioning of the organization

How do you do this? Well by filling out the super easy Process Summary Analysis Template of course!

Process Summary Analysis Template Instructions

Step 1: Put in the number of process Steps

Step 2: Enter the amount of time it takes to complete this step in minutes (don’t know exactly? Time it a few times or guesstimate for now), sum that row in minutes, and its % is 100% because we are summing the whole process.

Step 3: Identify which process steps are value added and not value added. Sum the number of minutes for all the boxes that you’ve identified (in this case we have an x in step 1 and step 6 at 1 minute and 5 minutes respectively, so we have 6 minutes of value added work and 75 minutes of non-value added work).

Step 4: For those steps that are not-value added, identify what the type of non-value added activity it is.

Step 5: Assess the percentages, and start working on the biggest first.  In this case 56% of the non-value added steps are due to External Failures.

Screen Shot 2014-09-19 at 9.48.28 AM

That should keep you all busy for a little while!

Ruthie…I guess this means you have to give our readers some Cause-Effect Diagram templates next week. You’re welcome. 🙂

Also stay tuned for more info about our new “Leading Process Change” Course!  Over the next few weeks you’ll see guest blogs from our speakers, more info on the course, and more templates I think!

What do you think of this template? Did you use it? Was it helpful?  Let us know at info@whiteboardconsulting.ca/staging or Tweet us at @whiteboardcons! More questions for us?  Use #DearRuthandNicole!

Until Next Time,

Nicole


How to Process Map When You Don’t Know What You’re Doing

whiteboardconsulting.ca/staging: Peacocks and ProcessesThis week a friend emailed me to ask for some process improvement advice. He has been thinking about a business process in his office, and knows something isn’t working the way it should, but isn’t quite sure what it is.

In fact, he wasn’t even sure how to articulate what he was looking for.

“This is probably the kind of thing that you guys could do for me, but I don’t even know what I want yet. Do you have anything like a template or a document that lists your process for drawing out how a process is working?”

Funnily enough, we don’t. When Nicole and I facilitate process improvement sessions it comes to us naturally, based on a few key questions:

  1. What is the “pain point” that you want to fix? Or, what is that “one thing” that drives you bananas when you drive home on Friday evenings, thinking “if only we didn’t have to deal with “this thing”, everything would be better?
  2. What kicks off your process? What’s the first step? You might think this is an easy question, but we once spent 45 minutes with a client helping them answer it.
  3. When is your process finished? What’s the last step? Is it when something is produced? Or when the customer recieves it? Or when the cheque comes in?

And that’s enough to get us started. From there we interview the key people involved in a process, draw it on huge Post-It paper on the wall, and then review it with people to ensure it’s accurate.

At that point the opportunities to improve pretty much jump off the page.

My Response to Him

Assuming you know nothing about a process map (forgive me if you do):

  • square shapes represent a step in the process
  • circles/ovals are beginning and end points
  • diamonds are decision points
  • arrows direct the flow from one step to another
  • the rows, or swimlanes, represent each person or group or organization who “touch” the process
  • A completed process map a beginning and end (duh), has all the process steps in the appropriate row depending on who completes the step, has decision points where ever an approval is needed (e.g. Approved? Y/N) and then appropriate steps for both Yes and No possibilities, has numbered steps (makes it easier to refer to specific steps later if you’re talking to someone about it).

You can use a pencil to document your process directly on the page, or you can have a big piece of paper on the wall and use sticky-notes (one for each step). This makes it easy to move them around if you need to. Use the attached template to help you out. (Click here for the process map template: WBC Process Map Template.)

  1. Determine the swimlanes – who has some involvement (no matter if it’s only one step) in any aspect of the process?
  2. Determine the trigger point – what kicks the process off?
  3. Consider the end point – how will you know when the process is done?
  4. Put a circle shape in the swimlane for the person/group that starts things off. Write the word “START” in it.
  5. Put a square shape next to the circle and label it #1, and write the step.
  6. Proceed with each consecutive step.
  7. Add the arrows last (you almost always have to change them as you go).
  8. When you reach the end point, put a circle with the word “END” in it.

His Response to Me

Ever the clown, my friend responded with, “do you realize how ironic it is that you don’t have a process document for your process mapping process?”

Isn’t it though. So ironic. See if I help HIM out again… sheesh…

Until next time,

Ruth.