It’s an old cliché: “What gets measured gets done.” The origin of the statement is up for debate (click here if you want to geek out a bit on that – some say it goes back to Rheticus in the 1500’s!), and it seems that the original phrase was actually “If you can measure it, you can manage it.”
Regardless of the origin or the wording, the message is clear: measuring something gives you the information you need in order to make sure you actually achieve what you set out to do.
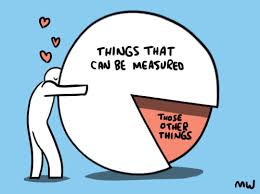
But what does that mean, exactly? How does measuring weight ensure weight loss? How does tracking monthly revenue actually bring in the money?
Two Ways Measurement Leads to Goal Achievement
- How often have you heard (or said) “it’s not on my performance objectives, so it’s not a priority for me.” For many people, the simple act of measurement increases motivation to perform. The term “eustress” refers to “good stress,” or the opposite of distress, and captures that healthy response to stress we have when something is attainable, but almost too far out of research. Research shows that the desire to win is heightened when rivalry and time pressure coincide, and the simple act of measuring something sparks that sense of rivalry in many people. Of course that rivalry doesn’t need to be with others, it can be with one’s own self as a sort of “competition” to see whether you can beat a goal. Without a measure, there is no way to determine whether you have won, and therefore, less motivation to get something done.
- There’s a small matter of accountability. When we set goals and measure performance against that goal we have the ability to hold ourselves (and others) accountable for the resulting success or failure. We actually have concrete data that shows us what we did or didn’t do, what the impact was, and what we need to do differently. Without accountability we can’t coach people towards success and growth, and we have a heck of a time meeting our overall targets.
So is that all we have to do? Measure something and it will magically happen?
Of course not. In addition to things like project planning, project management, and change management, there is this little matter of measuring the right things.
Business Intelligence, Not Barfing Numbers on a Page
Have you ever been the recipient of an Excel spreadsheet that is masquerading as a report of some kind? Columns and rows of data and boxes and percentages and bolded numbers and you have no idea where to look? Unless you are really familiar with the information, you’re probably going to file that report in some never-to-be-looked at folder in your inbox. Sadly, you won’t be able to refer to it later and sound super smart either.
There are a few things that you can do to make your reports interesting, helpful, and meaningful. If you are someone who is responsible for business analytics, consider the following:
- Understand the difference between a measure and a metric.
- A measure is one quantitative number that counts something. e.g. We made $100,000 profit last quarter.
- A metric gives you more information because it compares the measure to some other baseline. e.g. We made $100,000 profit last quarter, $50,000 more than the same quarter last year.
- Understand the difference between an Outcome metric and a Performance metric.
- An outcome metric tells you the result of something. It’s a “lag measure,” because once you have the measure it’s done. Over. Too late to do anything with. e.g. We made $100,000 profit last quarter, $50,000 more than the same quarter last year.
- A performance metric tells you how well the activities are performing that have been determined as the most likely to positively impact the outcome. These are “lead measures,” because they are driving the outcome in advance of the measurement of that outcome. e.g. For the last three weeks we have averaged 10 sales calls per week, which is above our target of 8 sales calls per week.
- Figure out what you want to know before you start measuring things. Often times reports are a dumping ground for all the data that’s available, whether it’s useful or not. These types of reports do NOT contain the motivational metrics and measures that create eustress and increase performance.
- Design your report to tell a story. Once the right data is measured and collected, the report should contain eye-catching information to lead the reader to the most important points. Make it visual, interesting, and helpful, and you will become the “go-to person” for people who want to know what’s going on.
We are teaching a course in Toronto on the basics of Performance Measurement. It’s a two-day course on May 26th and May 27th, and if you’re interested in knowing more about how to move your organization towards one of data-based decision-making, then click here and register today.
Until next time,
Ruth.