 Nicole and I have stumbled into a bit of a theme these days, talking about the basic activities involved in Process Improvement and sharing with you some user-friendly and simple templates. First, we wrote about how to actually map a process, and next we covered how to look at that process map and assess which steps are a waste of effort – i.e., they add no value. Both those blog posts include handy templates which you can edit and manipulate to suit your needs.
So now what?
In Nicole’s example, we learned that External Failures were taking 56% of the total time involved in completing a process. Since External Failures are clearly non-value-add steps, that is where we will focus. It may seem obvious, but often it’s over-looked so I’ll say it again: start your process improvement work on the steps that offer the most efficiency opportunities.
The next step then, is to look closely at the External Failures and think about what might be some root causes for them. By reducing or eliminating them, not only will we reduce the chance of upsetting a customer, but we will reduce the amount of time it takes to complete the overall time to do the process.
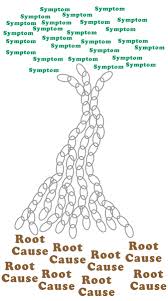
Root What Now?
Root cause. The main thing that is causing a process to fail. Here’s an example: a customer’s dessert arrives and it is burnt. What might the root cause be for that? There may be a few of them, so let’s brainstorm. The customer received the burnt cake because:
- the server wasn’t paying attention
- the oven was too hot
- the recipe was wrong
- the chef wasn’t watching the oven
- the oven timer was broken
There are a few examples of why the cake might be burnt. Are they root causes? Nope. They are sub-causes. Let’s dig deeper:
- the server wasn’t paying attention because:
- he/she was rushing
- the oven was too hot because:
- the thermostat was broken
- the recipe was wrong because:
- the chef made it from memory
- the chef wasn’t watching the oven because:
- he/she was receiving an order of fresh vegetables during dinner service
- the oven timer was broken because:
- it hasn’t had any maintenance in 5 years
So are those root causes? Maybe. Let’s take a look:
- the server wasn’t paying attention because:
- he/she was rushing because:
- three servers called in sick and there was no backup plan
- he/she was rushing because:
- the oven was too hot because:
- the thermostat was broken
- the recipe was wrong because:
- the chef made it from memory because:
- he/she learned it from someone else who didn’t write it down
- the chef made it from memory because:
- the chef wasn’t watching the oven because:
- he/she was receiving an order of fresh vegetables during dinner service because
- the delivery truck was late
- he/she was receiving an order of fresh vegetables during dinner service because
- the oven timer was broken because:
- it hasn’t had any maintenance in 5 years
Brainstorming with Fish
We’re getting closer. We have a few root causes in there now, and a couple of others might even be able to go further. A great way to do brainstorming like this is to think in terms of categories of what could possibly go wrong. You can use whatever categories will work for you or your business, but some common ones include:
- Equipment
- Process
- People
- Materials
- Environment
- Management
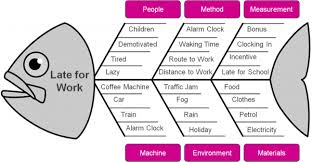
A tool we love to use originated in Japan in the ’60s. Known by several names (Ishikawa diagram, Cause-and-Effect diagram, and Herringbone diagram, to name a few), we use the most common title – the Fishbone Diagram. This diagram is nothing more than a brainstorming tool that helps groups think about potential root causes of a problem or issue. Lucky for you, click on this Fishbone Template for you to use in your next brainstorming session. It will download automatically.
Here are the steps in using it:
- At the “head” of the fish, write the problem you want to address.
- At the end of each of the “bones” of the fish, write the categories you’d like to use. (Whichever ones will stimulate the best discussion.)
- You can start brainstorming sessions several ways. One we like to use is to give everyone a stack of sticky notes and a pen. Ask them to look at the categories and write down as many potential causes as they can – one per sticky note. Now have everyone put their sticky notes on the wall, clustered in the six categories. Discuss and add more (because people always think of more). Remove duplicates.
- Draw a line towards each “bone” and write the potential cause on it.
- Ask if there are any further “bones” that might go off of the one you just wrote. If there are, then draw a line connected to that line.
- Keep going until you’ve written down all the ideas, and then ask if there are any more.
- Done!
Now you have a big list of ideas, and the trick is to figure out which one of those is the most impactful. How do you know which one(s) to fix first? Well, Nicole will tell you that next week… so stay tuned!
Until next week,
Ruth
PS – details on our new course, Leading Process Change, are coming within the next few days. Stay tuned to our Twitter (@whiteboardcons) and Facebook feeds, not to mention our website.

