
Post-Process Mapping
A few weeks back Ruth blogged about how to do a basic process map (click here to check it out) and it included a free process template for you to use as well. You’re welcome. Process mapping is a huge part of our business. We know process mapping creates engagement and buy-in for process change (when done in a workshop setting) , is a great visual tool, and can improve effectiveness and efficiency.
 Ruth talked about the key steps in documenting a process; the steps include:
- Determine the swimlanes
- Determine the trigger point
- Consider the end point
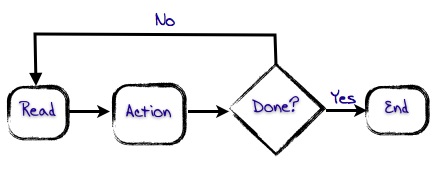
- Put a circle shape in the swimlane for the person/group that starts things off. Write the word “START” in it.
- Put a square shape next to the circle and label it #1, and write the step.
- Proceed with each consecutive step.
- Add the arrows last (you almost always have to change them as you go).
- When you reach the end point, put a circle with the word “END” in it.
AND, I can’t believe Ruth forgot this. I am going to gloat since she is a stickler for this one.
9. NUMBER your steps (post-production comment from Ruth – I am mortified! I can NOT BELIEVE I forgot that… and is such a public way! I will never live it down. Sigh.)
We received a lot of really good feedback on this blog, and people loved the template. The big question was:
What do I do next, after the Process Map?

Great question. The next 2 steps are to validate your process map and look at value added steps.
Validation
So if you’ve done your process map in a workshop style setting, you likely had many of the stakeholders (the swimlanes) of the process in the room. So validation in this case is finalizing that process map and sending it back out to those participants to see if what you’ve documented is accurate.
If you’ve worked on a process map by yourself, validation becomes even more important. You are verifying that all the steps are accurate and represented properly. In fact, this is an opportune time to re-group and re-engage to validate the map, or engage for the first time. A few things to keep in mind:
- Talk to the people in the process and follow the product or service through the service to make sure steps and swimlanes have been captured accurately.
- Make sure to capture easily seen or invisible steps (i.e. where the product or service is waiting, or being moved to another area)
- Ensure that you haven’t mapped the best case scenario, or worst case scenario. The map should be representative of how the process normally works.
Now for the meaty stuff….
Next we are going to analyze the process! First let’s determine whether a step adds value or not? Ask these 3 questions:
- Does the customer consider this step important?
- Has the product or service had a physical change?
- Was it done right the first time?
Here you can identify the type of non-value added activities. Non-value added activities include: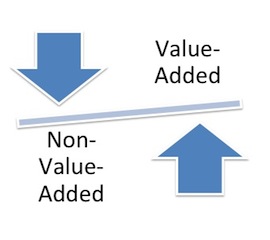
- Moves: Steps in the process where the product or service is in transit from one place to another. How many times and to how many people in your organization does this touch?
- Delays: Steps in the process where the product of service is waiting for the next step in the process (a great example of this is approvals or sign-offs). This is your classic bottleneck.
- Set-up: Steps in the process that prepare the product or services for a future step
- Internal Failures: Steps that have to be re-done (i.e. iterations of something before it reaches final approval) that are detected internally
- External Failures: Steps that have to be re-done that are detected by the customer (i.e. damaged product at shipping….)
- Control/inspection: Steps where the product or services is reviewed to ensure customer satisfaction (i.e. Quality Control)
- Value Enabling: Steps that don’t add value but are necessary for the functioning of the organization
How do you do this? Well by filling out the super easy Process Summary Analysis Template of course!
Process Summary Analysis Template Instructions
Step 1: Put in the number of process Steps
Step 2: Enter the amount of time it takes to complete this step in minutes (don’t know exactly? Time it a few times or guesstimate for now), sum that row in minutes, and its % is 100% because we are summing the whole process.
Step 3: Identify which process steps are value added and not value added. Sum the number of minutes for all the boxes that you’ve identified (in this case we have an x in step 1 and step 6 at 1 minute and 5 minutes respectively, so we have 6 minutes of value added work and 75 minutes of non-value added work).
Step 4: For those steps that are not-value added, identify what the type of non-value added activity it is.
Step 5: Assess the percentages, and start working on the biggest first. In this case 56% of the non-value added steps are due to External Failures.

That should keep you all busy for a little while!
Ruthie…I guess this means you have to give our readers some Cause-Effect Diagram templates next week. You’re welcome. 🙂
Also stay tuned for more info about our new “Leading Process Change” Course! Over the next few weeks you’ll see guest blogs from our speakers, more info on the course, and more templates I think!
What do you think of this template? Did you use it? Was it helpful? Let us know at info@whiteboardconsulting.ca/staging or Tweet us at @whiteboardcons! More questions for us? Use #DearRuthandNicole!
Until Next Time,
Nicole