Tag Archive: Lean

Should you follow the pack or go rogue?

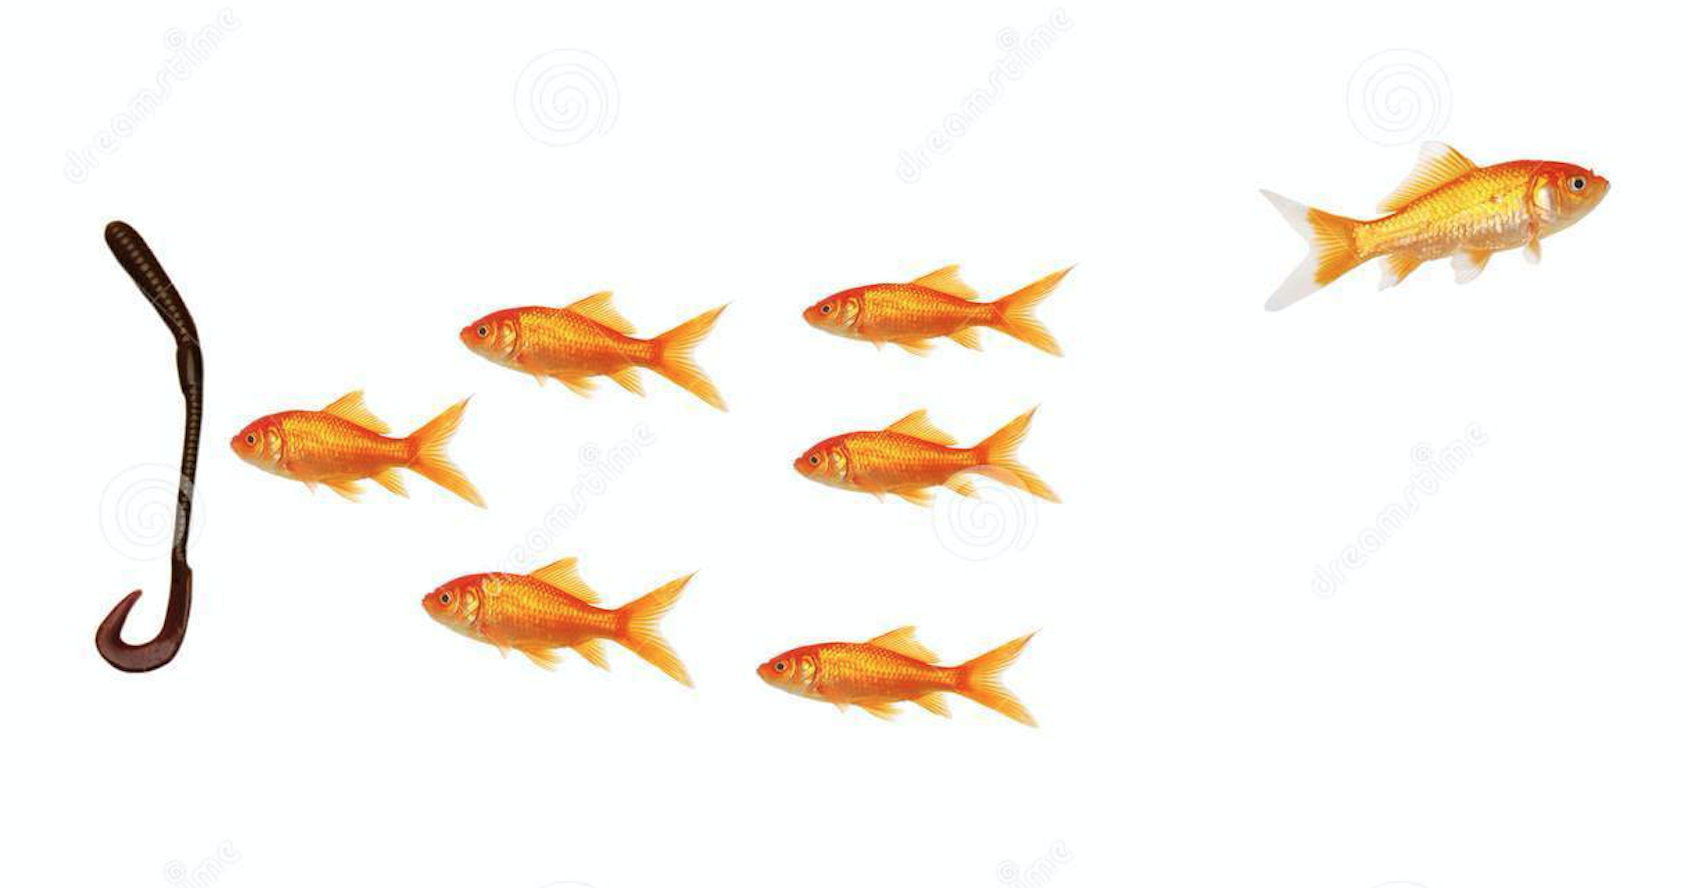
I’ve been thinking lately about our human tendency to follow the pack and my newfound tendency of “going rogue.” I’m a trusting person and easily influenceable. If you tell me this is the BEST HAND CREAM EVER, I will buy it.  If you tell me you tried a new workout and it was THE HARDEST WORKOUT EVER, I will go and try it tomorrow.  Ask me to smell this milk because it is the MOST EXPIRED MILK EVER, I will get my nose right in there.

So it’s a newfound habit for me to say, “That’s awesome that it is working for you.  Right now I’m doing this, and it is really working for me too. Yay us!”

But Everyone Says So!

People (and probably some science reports too) say that we MUST eat breakfast; doing so helps us consume fewer calories later in the day and maintain a healthy weight and may even improve our concentration and productivity. They also say we shouldn’t weigh ourselves every day because it could case us to become over fixated on what may be natural fluctuations rather than indications of weight gain or loss.

“They” say we shouldn’t look at our phones first thing in the morning – it can distract us from our morning routine and can decrease our productivity by focusing on external priorities rather than our own.

And we mustn’t work out every day, because our bodies won’t have adequate time to recover and we won’t get results.  

Screen Shot 2016-06-02 at 4.57.45 PM

Don’t get me wrong, I realize there are studies and science  that may back these statements up with statistical significance.  But here’s the thing: all of the “pack ideas” I talked about above don’t work for me.

When I eat breakfast, I’m starving all day and (after testing this theory out by tracking and monitoring the data) I consume more calories than are necessary for me to maintain my weight. So do I keep doing it because everyone else is telling me that is the right thing?

Similarly, weighing myself every day keeps me on top of fluctuations that could otherwise be more dramatic after a week.

And I LOVE working out.  Provided I balance my workouts, it is my stress relief and my time that makes me happy. So why should I be unhappy, provided I am being safe and taking care of my body, when my way works for me?

And finally, if I don’t check my phone before bed AND first thing – guaranteed I will miss a meeting, or miss a cancellation of a meeting and make an unnecessary trip.

Now statistically speaking these “rules” might be great for the majority of people, and the majority of people will see better results following these rules.  But, as we know, there is a great deal of human variation.  I am a sparkly unicorn and I am different.  These rules do not work for me.

The thing is, it’s easy to follow the pack.  It’s part of our human nature.

…social conformity is based on mechanisms that comply with reinforcement learning and is reinforced by the neural error-monitoring activity which signals what is probably the most fundamental social mistake – that of being too different from others

Read more: http://news.softpedia.com/news/039-Follow-the-Crowd-039-Tendency-Finally-Explained-102066.shtml#ixzz4ASKrOwCW

Follow The Pack? Or, Go Rogue!

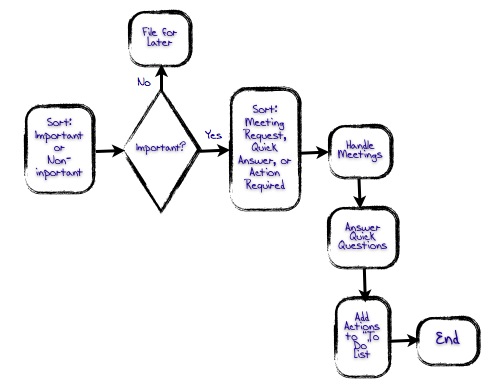
Maybe your competition uses a certain process improvement methodology (like Lean or Six Sigma), or a particular sales tool, or social media strategy and you want to implement it to keep up with the trends. But what if it just doesn’t work for YOU (and your team, and customers, and stakeholders)?
keep-calm-and-go-rogue

  1.  Does it feel natural to do what the pack is doing?  Sure, good habits take time and consistency, but if the process is so difficult that you can’t get the habit to stick, maybe it isn’t the right strategy for you.
  2.  Have you experienced errors, defects, or problems using the pack’s idea? If you notice missed deadlines, faulty products, decreased employee engagement, or increased customer complaints – maybe you need to re-examine your plan.
  3.  Have you tried and tested any other options? If you haven’t tested and tried out alternatives, how do you know that this is the best for you?  How can you make a decision with out data – numbers or experience? Reflect on the past – was there a time that you were doing really well?  What were you doing?  Should you align with the pack, or “go rogue”.

Let us know how you follow the pack or go rogue @whiteboardcons #gorogue or #followthepack!

Until Next Time,

Nicole

(Process) Rules Are Made to Be Broken

rules

It’s true. Rules are made to be broken. Even in the world of Process Improvement.

“Wait, what?” you ask. “But Ruth, process improvement is all about rules and statistics and doing things the same way every time, yada yada yada. You’re contradicting the very foundation of what Whiteboard teaches!”

Ah, nothing is so black and white, grasshopper. Hear me out.

Process Improvement is Changing

In my process career I have witnessed and/or been part of many process improvement initiatives – big, small, fully funded and supported, done “off the corner of a desk”, successful, and unsuccessful.

The two things that made the difference between success and failure – in addition to the usuals of effective communication, engagement, and senior management commitment – were:

  1. Early evidence that the new methods work and are worth the effort, and
  2. The ability to be flexible and change your mind.

And this last one, flexibility, seems to be growing in importance. In fact, it also influences the first one – “evidence of success.”flexible

Traditional and, dare I say it, soon to become “old school” methodologies like Six Sigma and to some extent Lean, are based on strict methodologies that work really well in some organizations – usually those in a manufacturing or highly repetitive/operational industry. In other industries, particularly serviced-based, these methods have a more difficult time taking root. It’s not impossible, and there are many very successful examples – but it is harder.

It’s OK to Change Your Mind – Just Don’t Squirrel

When Nicole and I teach The Whiteboard Way©  to aspiring process-improvement practitioners, we are careful to point out the need to be flexible, and to change things along the way if they aren’t working. The ability to do this is refreshing to people who are often nervous about adopting a new method, or taking on “this process stuff.”

I recently did some strategic planning with a client – he was a little nervous about planning tactics for goals that were 12-24 months out. “Things can change, Ruth,” he said. And he was right. That’s why it’s important to have a plan and a process, and then if (when) things change you can make intentional decisions to veer away from or modify the plan. But – the modification is then intentional, not just because you saw a fun-looking squirrel and decided to run after it like the dog in the movie Up (love this clip: click here). Some people do this so frequently, that Nicole and I actually use “squirrelling” as a verb.

In the Four Disciplines of Execution, Sean Covey stresses the importance of using and tracking lead measures – those which you can influence and which drive the progress towards a goal – in the execution of a goal or strategy. His theory is that a “cadence of accountability” ensures that people develop the habit of reviewing their commitments and assessing whether those tactics (or lead measures) are making the progress they expected. If they’re not, then they change the tactics and the things they measure until it has the desired result. (Click to Tweet)

In the The Whiteboard Way© we teach the same principles. We combine traditional process improvement tools with modern theories about being flexible yet accountable, and we show how this approach generates increased engagement and better results.

Have you had success doing process improvement this way? Tell us about it!

Until next time,

Ruth.

Beginners Guide: Using Appreciative Inquiry for Process Improvement

This week, as I finish my certification process in Appreciative Inquiry (AI), I thought I’d give our readers a little understanding of how we’ve used AI and applied it to our process work.

Our  process background has led us to focus on gap assessment and gap analysis as a primary methodology for seeking process improvements and identifying opportunities for improvement.  Our facilitation methodology was usually centered around questions like: “What is your pain point?” Or “What is the one thing you would change?” Or “What would make things better?”

This type of gap assessment methodology is highly successful and works extremely well in organizations that:

  • Have a strong (positive) organizational culture
  • Are accustomed to process improvement or are seeking it out
  • Have process aptitude or orientation
  • Are resilient to change

We’ve applied the AI methodology to our Process Improvement Part One and Part Two courses (part of the Whiteboard University Curriculum that we’ll be offering this fall).  Our Whiteboard Way teaches the following concepts:

  1. Define It! Learn to develop a problem statement to effectively describe a potential process improvement project.
  2. Draw It! Use basic process mapping tools to graphically represent the process at hand and begin to identify possible areas for bottlenecks, duplication of effort, or unclear roles and responsibilities.
  3. Imagine It! Use tools like a fishbone diagram to effectively search for root causes, and thus possible solutions to the problem identified in step 1.
  4. Prove It! Use data to demonstrate how the improved process could be measured against current performance.
  5. Talk About It! Effectively communicate process changes throughout the organization to support uptake of the new process and manage progress throughout.

We applied AI methodology (and Summit framework) in the following 2 steps of the Whiteboard Way:

Screen Shot 2014-07-24 at 11.07.37 AMTools We Use

Opportunity Map

Following an exercise to identify problem statements from a number of groups, the problem statements are collected and documented on a whiteboard. Process improvement project problem statements are then reframed  in the positive using AI methodology to talk about the ideal process or ideal experience to generate future state discussions that feature best-in-class processes.

Using multicoloured dots, individuals from each table group are able walk to the whiteboard and “vote with their feet”  on the top 3-4 projects that are of most interest to each individual.  The top 3-4 winning projects are then spaced around the room and participants are asked to join the project that is of most interest or that the participant feels could provide the most value from a knowledge perspective. For the most part teams naturally tend to be naturally evenly distributed, but wherever necessary shift to create somewhat equal participation between groups.

Using the opportunity map creates a great deal of engagement in the group. We have noticed that every person who joins a new project group has a vested interest in the outcome, and their excitement and engagement is palpable right away – versus teams being forced to work on pre-defined problem statements.

The re-shuffling of table groups based on working on the new problem statement of their choice truly helps to capture not only individual engagement, but the appropriate level of knowledge base within the group.

AI Questions/Reframing

In order to facilitate the Imagine It! portion, we first use traditional process improvement methodology using a fishbone diagram to determine possible root causes for the problem statement.  This is where traditional process improvement would end – what we do differently is ask them to then consider the possible root causes, and using AI question techniques begin to envision a future state for the problem.  The guided questions for each problem/opportunity statement are as follows:

  1. What is the current strength of this process?
  2. What are you proud of?
  3. Can you tell a story of when this process worked well?
  4. What are the key themes of success? (Using the Fishbone diagram as a guide: People, Processes, Materials, etc.)
  5. What does this process look like in one year, once it has been reengineered and is working effectively?
  6. What measures can we use to see how successful the new process is (versus the old process)?
  7. What things need to be done in order to get there?

The teams are then able to effectively leverage current components of the process that work the best, identify what needed to change, and what needs to happen in order to make that change.

Reflections on impact on participants

Using this new style of questioning is a fundamental change from classic process improvement.  Often during the Imagine phase there is a great deal of change resistance to changing the process, especially when certain parts appear to be working. Leveraging the parts of the process that work well allows that resistance to diminish significantly. The “pain points” and “what is the one thing you would change” conversation in a typical gap assessment tend to devolve into “personnel issues” rather than process issues. Often people determine that it in fact was not the process that was broken, but the owner of those process steps that is to blame for the variability in the outcome of the process.

The AI methodology  paired with gap analysis allows participants to steer clear of the negative, and focus on positive process improvements that are more fruitful than those that develop from pure process gap analysis alone (Click to Tweet).

Reflections on AI

While traditional gap assessment methodology is still a large component of process improvement initiatives, the use of AI is very effective when there is significant resistance to change or organizational culture issues that tend to draw negative conversations rather than opportunities.  This is completely normal for process improvement where users of a process experience the effects of the change curve, namely first disbelief in the efficacy of the methodology, anger possibly due to fear of the unknown or lack of skills to execute the newly developed process,

New questions or observations

It would be interesting to document a process improvement project that used AI exclusively as a methodology against one that used gap analysis to assess whether the improvements using AI could in fact yield better results.

Our opinion is that differing methods work for different individuals, so blending the two approaches meets the needs of all stakeholders and will yield the best possible approach to engage a wide variety of thinking styles and communication styles.

Want to know more about AI and process improvement?  Send us a note.  Have any interesting AI stories?  Join the conversation on Twitter @whiteboardcons.

Until next time,

Nicole


Process Improvement via The Whiteboard Way© – Step Two

Last week Ruth started a series on The Whiteboard Way©, our very own process improvement methodology (this proved to be advantageous for me, as I was at a creative standstill with blog ideas. Thanks Ruth!)

First, a Little Background

A little recap – last week Ruth talked about the most critical step in The Whiteboard Way© – Define it! By removing assumptions and pre-conceived ideas about the solution, it allows you to be unbiased and creative in the possible solution.Today I’m going to delve into my love-hate relationship with process mapping.

Why do we process map?

Approximately 65 percent of the population are visual learners and people process visual information much faster.  Visually representing a process allows you to see things that may not necessarily jump out at you when you read a procedures document or when you just “imagine” the process in your head. Here are some things that jump out at you when  you process map:

  1. Touch points. How many people, teams, departments must a product or service pass through to reach the customer? The higher the number of touch points in the process the longer the process will take, and the higher likelihood that a defect (or error) will occur.
  2. Duplication. Process maps are great at visually highlighting work that is duplicated across the company by different teams. With our clients, we usually see a map highlight, for example, people that enter the same data into different databases, or forms in different areas of the organization.
  3. Bottlenecks. Bottlenecks occur when there is a blockage in the flow of information or work. For example, when a busy executive is holding an approval at their desk for days upon end.

So Ruth helped you develop your problem here. Some examples of  “Good” Problem Definitions are below:

  •  In the last 3 months we have had to fix this issue 6 times for four customers, causing dissatisfaction for our customers and wasted processing time for our staff.
  •  Each month we are 5-7 days late completing this process, impacting other departments and generating late fees for the company.
  •  This piece of work costs the organization $5,000 per month. Best practices in similar companies is half that amount.

report

Step Two: Draw It!

So now, take your “good” problem definition from last week , and think about the process(es) that contribute to it. There are many types of process maps out there, each serving a different purpose. We like to use the swim lane process map because it allows you to identify the ‘hand offs’ or touch points in the process. At this point you are mapping the As-is current state process, not the Should-be (in an ideal world), or Thought-to-be (what we think it looks like).  Get everyone in the room who touches that process and talk about what “ACTUALLY” happens.

There are four steps you need to remember when mapping a process.


  1. Determine level of detail. A high level view of your process will require 3- 5 process steps, while a more detailed view can have up to 20 process steps.
  2. Lay out your swim lanes. Identify how many people, positions, teams or departments are involved in the process (keep in mind the level of detail you have chosen to map it) . Create a swim lane for each. Your process should flow from the top to the bottom, left to right. So if your administrative assistant or your client starts off the process, their lane should be placed at the top. The same, if your shipping department is the last to finish the process, their lane should be placed at the bottom.
    whiteboardconsulting.ca/staging: Peacocks and Processes
  3. Use your Shapes. The are 4 key shapes to use when mapping. The oval represents the start and the end of your process. The rectangle represents your process step. The diamond represents your decision point. The arrows represent direction and connection. The diamond is the fork in the process and therefore will always two arrows, a Yes and No.
  4.  Number your Steps. Although the arrows help with direction, sometimes with complicated processes, you lose track of the flow, especially if there are a lot of decision point. For this reason it is important to number your process steps.


So get out your whiteboards, sticky notes, and markers, and start to Draw It! Let us know what you find out!

Leave us a comment below!


Until next week,

Nicole