Tag Archive: Process Improvement

Process Improvement via The Whiteboard Way© – Step Five

We’re finally at the last of the five steps of The Whiteboard Way© – Talk About It.

idea

“That’s a step?” you ask, “just talking about something?”

Why yes, yes it is.

There is a trick of course – it’s not just talking about what you’ve been doing. It’s communicating the right information, to the right people, using the communication method that they prefer. Or, it’s about effective communication.

Let’s Recap Steps One Through Four

In the last four posts we’ve taken you through all the basic steps for properly defining a problem, imagining

all the potential solutions, and proving that the solution you choose is the right one.

Step One: Define It! In which you describe the problem without assuming a solution.

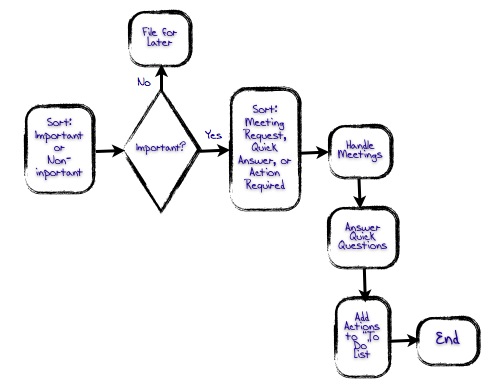
Step Two: Draw It! In which you visually express the problem in its current state.

Step Three: Imagine It! In which you brainstorm potential solutions and draw how they might look.

Step Four: Prove It! In which you build the case for the solution you want to implement.

Now it’s time to discuss the biggest roadblock to effective process improvement i

nitiatives – effective communication, or the lack thereof.

What Are You Talking About?

You’ve got the best idea in the world. You know it’s going to be big – your boss is going to love it, your colleagues are going to love it – heck, you may even get a raise. You’ve been doing all the steps of The Whiteboard Way©, working away at your desk on your lunch hours and even a couple of evenings at home. You’re super excited, and you finally are ready to let everyone know.

One morning as you and your colleagues are settling in for the day, you tell them all about your plans. A couple smile and say “good for you” and then sit down at their computers and open their eMail. One chuckles and says, “good luck with that”. And another says, “but that will change my work!”

You’re completely deflated. Don’t they see that this is a good thing?

Later that morning you have your weekly one-on-one with your boss and you tell her all about your amazing idea. You pull out your process maps and explain what you’ve been working on.

“How much is this going to cost?” she asks. And before you can answer, “what does the rest of the team think of this plan?”

“Uh, well, I haven’t had time to talk to them about it,” you reply, “and as for cost, I haven’t looked at that. But look how much we’ll save!”

“I’m sorry, but I need to know the cost. You know our budget is tight. And it looks like this process impacts the others – you need to make sure they’re on board.”

And that’s the end of that. What went wrong????

So Many Things.

How to Win the Communication Challenge

There are four key elements to the “Talk About It!” stage of The Whiteboard Way©:

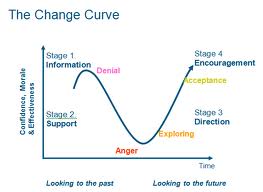
  1. Think about Change Management. You may have read our post about the Change Curve a little while ago. In it, we talked about how people go through a series of emotions (Disbelief, Anger, Exploring and Acceptance) when confronted with a change in their lives. Some go through all those thoughts in a few seconds – they are very resilient people and love change! Others take longer, and you need to consider this when planning on implementing a process improvement change. idea
  2. What’s Your Communication Plan? Who is your audience? Consider people who will be impacted by your idea, or who will be needed to implement or support it.  Now consider the method by which each of those people need to hear your message. Where are they on the change curve? Do they prefer face-to-face meetings or a quick eMail? Not what do you prefer… How do they prefer to communicate. How often? What message do you need to share
    , and what’s the right venue for it?
  3. Be Engaging. No, that doesn’t mean be all charming (although it can’t hurt). It means, engage people early in the process. Ask for their input, suggestions, and ideas. Bring them along your story, and make sure you have all your story elements (including ROI for your boss) figured out!
  4. Remember Your Project Management Essentials. A good project charter ensures everyone understands the scope of what you’re doing, the budget required, the people who will be impacted and who have already been engaged, and of course your key milestones and deliverables. This is one of the most helpful tools you can have, even for a small project! (Project charters don’t have to be pages and pages long.)

Let us know if you’ve had experience (good or bad!) with communication and process improvement projects, and whether any of the tools above resonate with you. Please use the comment space below or tweet us @whiteboardcons! And don’t forget to send us any general process improvement questions or suggestions for future blogs.

Until next time,

Ruth.

Process Improvement via The Whiteboard Way© – Step Four

Using Return on Investment and Cost Benefit Analysis in Process Improvement

Step Four: Prove It!

prove itAs we continue along our process improvement journey we focus today on PROVE IT!

But first, a little recap.  So far we’ve taken you through the first three steps of The Whiteboard Way© (if you haven’t checked them out yet, here they are):

  1. Define it!
  2. Draw it!
  3. Imagine it!  

We’ve regaled you with:

  • how to remove assumptions and pre-conceived ideas about the solution,
  • to be unbiased and creative in the possible solution,
  • then how to map a process to visually identify opportunities for improvement, and
  • lastly how to imagine a potential solution.

And now the rubber hits the road – we need to do some math to determine if your solution will work! Our first  task to to collect some data!

Collect the Data

We love to plan here at Whiteboard, and while often we want to jump the gun and just start collecting everything we can find, a great start is a data collection plan.  It helps organize data collection activities and makes sure everyone involved with it understands the goals and objectives to provide the best data possible.

Consider asking the following (to yourself ,your project team, and your stakeholders):

prove it 2

  • What data is needed?
  • Who is responsible for getting it? Why is it needed ?
  • How will it be collected?
  • When will it be collected?
  • Where will it be collected?

Cost Benefit Analysis

One of the biggest complaints we hear from teams and their management when we go to implement cost improvement activities are things like:

“We always try to tell management about these ideas, but they just ignore us!”

“Our teams have all these ideas, but they can never tell me why we should spend that much money on them!”

One of the reasons that great ideas often don’t fly is that they are missing rationale.   Everyone can tout the benefits of process improvement initiatives, but its a skill to be able to  articulate why the costs and efforts to implement  are worth it.  A cost/benefit analysis is a structured process for determining the trade-off between implementation costs and anticipated benefits of potential improvements. The analysis is done to ensure that a particular improvement is the most efficient one in a set of potential alternatives.

What is ROI?

roi


Return on Investment (ROI) is the difference between the gain from investment and cost of investment divided by the cost of investment. ROI considers hard costs and savings (actual reductions in costs to the organization). The business case to prove your solution should also talk about soft costs and soft savings (other organizational benefits like employee engagement that don’t have dollar values associated with them).


ROI= (Gain from investment – Cost of investment)/cost of investment

  So remember to consider the following when completing your cost/benefit analysis:

  1. All the costs associated with implementing the improvement
  2. Capital investment
  3. People costs (consultants, staff time)
  4. Training
  5. Lost production
  6. Determine the benefits of a fully-implemented improvement
  7. Calculate Return on Investment
  8. Keep it simple!

You might have come up with the best idea since sliced bread, but unless you talk about it, share it and explain it to others, it won’t happen! Stay tuned for our next blog on Talk About it! – how to communicate your process improvement idea!

Until then, please leave a comment – anything! Process questions, ideas for an upcoming blog, your thoughts on Toronto’s classy mayor…

Nicole

Process Improvement via The Whiteboard Way© – Step Three

This week we continue our series on The Whiteboard Way© by taking you through what just might be the “favourite” phase in the process improvement journey – “Imagine It!”

Why is it the favourite phase? Well, it’s because most people have a solution in mind when they start this journey, and up until now we haven’t allowed them to even suggest it. We were all about  problem definition in Step One (remember, no solutions) and then the visual representation by drawing the current state in Step Two. In the third phase, we finally get down to business and talk about some possible ways to fix the problem.

Finally! I Can Just Implement My Idea, Right?

Um, no. Sorry. There are a few things we need to do to make sure that your idea not only will fix the problem, but that it’s also the best place to start. Sometimes great ideas are trumped by new ideas that we find in the first few steps of Step Three. If you can hang in a little longer, what we want to do next is brainstorm all the possible causes for the problem you designed in Step One, and drew in Step Two.

We’ve been looking at three different problem statements in this series:

  •  In the last 3 months we have had to fix this issue 6 times for four customers, causing dissatisfaction for our customers and wasted processing time for our staff.
  •  Each month we are 5-7 days late completing this process, impacting other departments and generating late fees for the company.
  •  This piece of work costs the organization $5,000 per month. Best practices in similar companies is half that amount.

Let’s take a closer look at the first example. It seems that we’ve sent the wrong thing to our customers 3 times in 6 months. Our shipping manager is pretty sure that it’s because we hired 4 new people in the warehouse, and they’re just not using the shipping system properly. He’d like to do some training for them – it will cost $1,500 a person to attend a two day course, and will require hiring temps to backfill while they’re off at training.

In “Imagine It”, the first thing we have to do is think of all the potential reasons for the mis-shipped products. We love to use a tool called a Fishbone Diagram to help people come up with “root causes” for the problem. This diagram is best drawn on a big whiteboard or brown roll-paper on the wall. At the head of the fishbone you put the problem “Mis-shipped products”. Each of the bones in the spine represents a common category of root causes. These categories are designed to trigger thoughts while brainstorming – participants use them to think of all the things in that category that could possibly impact the outcome.

A completed Fishbone Diagram for this issue might look like this.

Screen Shot 2013-11-09 at 6.32.38 PM

Actually, it would probably look much messier and with dozens more ideas. But let’s run with this one.

Our shipping manager’s idea of training being the big concern is right there on the fishbone, under the “People” category. But during the brainstorming session, someone pointed out that there have been a few power outages recently and that all the picking had to be done manually. Also that the website had been updated, and that customers in Vancouver had called in with issues using the online order forms.

Suddenly, the training idea has taken a back burner until the other ideas are investigated. It doesn’t mean it’s a bad idea, or even the wrong idea – it’s just that a little more investigation is needed first.

In this case, it turns out that the power outage was the root cause – each mis-shipment was linked directly to times when the picking process had to be done manually.

Now What?

A few things. First, you might want to investigate why you’re having so many power outages! Is it a freak of nature or do you have electrical issues? Second, how can you improve the manual picking process? Use your new process mapping skills to look at the current process and see where there might be room for improvement and ways to prevent mistakes from happening (the Japanese term for this is Poke Yoke – error proofing).

You might want to prove that the new process will work too. That’s the topic for next week.

Until then, please leave a comment – anything! Process questions, ideas for an upcoming blog, your thoughts on the Maple Leaf’s’ chances this year. Whatever!

Ruth.

Process Improvement via The Whiteboard Way© – Step Two

Last week Ruth started a series on The Whiteboard Way©, our very own process improvement methodology (this proved to be advantageous for me, as I was at a creative standstill with blog ideas. Thanks Ruth!)

First, a Little Background

A little recap – last week Ruth talked about the most critical step in The Whiteboard Way© – Define it! By removing assumptions and pre-conceived ideas about the solution, it allows you to be unbiased and creative in the possible solution.Today I’m going to delve into my love-hate relationship with process mapping.

Why do we process map?

Approximately 65 percent of the population are visual learners and people process visual information much faster.  Visually representing a process allows you to see things that may not necessarily jump out at you when you read a procedures document or when you just “imagine” the process in your head. Here are some things that jump out at you when  you process map:

  1. Touch points. How many people, teams, departments must a product or service pass through to reach the customer? The higher the number of touch points in the process the longer the process will take, and the higher likelihood that a defect (or error) will occur.
  2. Duplication. Process maps are great at visually highlighting work that is duplicated across the company by different teams. With our clients, we usually see a map highlight, for example, people that enter the same data into different databases, or forms in different areas of the organization.
  3. Bottlenecks. Bottlenecks occur when there is a blockage in the flow of information or work. For example, when a busy executive is holding an approval at their desk for days upon end.

So Ruth helped you develop your problem here. Some examples of  “Good” Problem Definitions are below:

  •  In the last 3 months we have had to fix this issue 6 times for four customers, causing dissatisfaction for our customers and wasted processing time for our staff.
  •  Each month we are 5-7 days late completing this process, impacting other departments and generating late fees for the company.
  •  This piece of work costs the organization $5,000 per month. Best practices in similar companies is half that amount.

report

Step Two: Draw It!

So now, take your “good” problem definition from last week , and think about the process(es) that contribute to it. There are many types of process maps out there, each serving a different purpose. We like to use the swim lane process map because it allows you to identify the ‘hand offs’ or touch points in the process. At this point you are mapping the As-is current state process, not the Should-be (in an ideal world), or Thought-to-be (what we think it looks like).  Get everyone in the room who touches that process and talk about what “ACTUALLY” happens.

There are four steps you need to remember when mapping a process.


  1. Determine level of detail. A high level view of your process will require 3- 5 process steps, while a more detailed view can have up to 20 process steps.
  2. Lay out your swim lanes. Identify how many people, positions, teams or departments are involved in the process (keep in mind the level of detail you have chosen to map it) . Create a swim lane for each. Your process should flow from the top to the bottom, left to right. So if your administrative assistant or your client starts off the process, their lane should be placed at the top. The same, if your shipping department is the last to finish the process, their lane should be placed at the bottom.
    whiteboardconsulting.ca/staging: Peacocks and Processes
  3. Use your Shapes. The are 4 key shapes to use when mapping. The oval represents the start and the end of your process. The rectangle represents your process step. The diamond represents your decision point. The arrows represent direction and connection. The diamond is the fork in the process and therefore will always two arrows, a Yes and No.
  4.  Number your Steps. Although the arrows help with direction, sometimes with complicated processes, you lose track of the flow, especially if there are a lot of decision point. For this reason it is important to number your process steps.


So get out your whiteboards, sticky notes, and markers, and start to Draw It! Let us know what you find out!

Leave us a comment below!


Until next week,

Nicole


Process Improvement via The Whiteboard Way© – Step One

This week we’re starting a series on The Whiteboard Way©, our very own process improvement methodology.

First, a Little Background

When we started Whiteboard Consulting Group, one of the things we wanted to do was develop a way to do process improvement that would be easy for people and organizations who had never tried it, never heard of it, or thought that it had to be big, cumbersome, and expensive.

Our method is simple, has only 5 steps, doesn’t rely on expensive software, and can help you begin your process-improvement journey. Think of  The Whiteboard Way© as the act of “tilling the soil” – getting it ready for the culture shift towards continuous improvement that will surely follow.

Step One: Define It!

Perhaps the most difficult part of getting a process improvement project off the ground is actually defining the problem. Why is this so important? Because if we really take the time to think about it, removing all assumptions and pre-conceived ideas about the solutions, we can ensure two things: 1) an unbiased approach to problem solving, and 2) an open approach to all possible solutions. In other words, we can guarantee the best solution.

albert-einstein-quote

“But Ruth!” you exclaim, “that’s the easiest thing to do, isn’t it? If we didn’t know what the problem was, we wouldn’t be having this conversation, right?”

Not necessarily.

It is absolutely true that you have an idea of the problem. We like to describe it as a “pain point”, or something that keeps you up at night or frustrates you and makes you listen to angry music on the way home (I recommend Nine Inch Nails or Metallica for those days). You sit at the dinner table with friends or family and say things like, “I can’t believe we had to fix this issue for another customer,” or, “every month it’s the same thing – we scramble to get this done at the last minute,” or “it shouldn’t cost this much to do this work”.

The hard part is defining what’s wrong without assuming why it’s wrong.

Here are some examples:

“Bad” Problem Definitions

We have to fix this issue all the time for our customers because we just don’t have time to train our people.

We never have enough time to do this process because other priorities keep getting in the way.

It costs too much to do this piece of work because I can’t hire the right people.

“Good” Problem Definitions

In the last 3 months we have had to fix this issue 6 times for four customers, causing dissatisfaction for our customers and wasted processing time for our staff.

Each month we are 5-7 days late completing this process, impacting other departments and generating late fees for the company.

This piece of work costs the organization $5,000 per month. Best practices in similar companies is half that amount.

Here’s how we do it in The Whiteboard Way©

  1. State the pain point.
  2. Add data – how much, how often, what’s the impact
  3. Add no solutions

It just takes practice. And we can help you with that. Comment below with your “pain points”!

Next week: step two. Draw It!

Until then,

Ruth.

All for One and One for All!

all for one

Ah, the Three Musketeers, Athos, Porthos, Aramis, and, of course, d’Artagnan – righting wrongs, fighting evil, and sharing witty remarks along the way (essentially the 17th century version of The Avengers). Their motto, “all for one and one for all”, has become the norm when cheering for teamwork and presenting a united front in the face of hardship or a common goal.

Interestingly, in the late19th century, the Swiss used the phrase as part of a campaign to bring about a feeling of solidarity and national unity during troubled times (following widespread flooding in the Alps), and it’s become their unofficial, but traditional, national motto.

The phrase was perfect for that particular campaign, as it really evoked that spirit of support and common accountability, reminding everyone that one is not successful unless everyone is successful.

So what does that have to do with business processes?

Everything.

All too often Nicole and I come across organizations with detailed strategic plans, tactical plans and clear roles & responsibilities, and yet they are either failing in their execution, or executing on the backs of employees who are demoralized, frustrated, and just plain tired.

Nine times out of ten, they’re missing that “all for one and one for all” mentality. Instead, they have organizational structures that promote an insular focus based on empire-building and individual success. Common accountability is nowhere to be seen.

The people in an organization are like the players on a sports team. On a winning team, each individual has a defined role, interacts with other people at set times, understands their goals and can compare themselves against performance metrics. Most of all, they know they simply can NOT be successful unless their team mates are successful. Who cares how many goalsteam you can score if no one can pass you the puck and the defense can’t keep the other team away from the net? (I can’t believe I just used a hockey analogy… I don’t even watch it. Go Leafs!)

A successful organization is one in which it behooves someone to make a colleague successful, because the individual’s gain is tied to the colleague’s success. It’s nice to take the high road and hope everyone will be altruistic in their approach (helping the other person be successful simply because it’s the right thing to do). However we know that although many people operate this way, it is often not the norm in a culture of pressing deadlines and reduced budgets.

Therefore, whether it’s via financial reward or some other kind of reward or benefit, mutual goals are critical to developing that atmosphere of collaboration and camaraderie.

Five Ways to Instill that “All for One” Culture

  1. Start to change your organizational culture by referring to employees as team members, and not as “staff”. It’s a small thing, but it really helps.
  2. If you have a bonus structure, create bonus criteria that include a shared or common accountability as well as individual performance. Many companies have 1/3 individual performance, 1/3 divisional performance, and 1/3 company performance as the weighting.
  3. If you don’t have a formal bonus structure, develop another means of rewarding collaboration. Tie performance to a common goal, and reward successful teams according to the type of reward that is most meaningful for them. (Don’t know what that is? Ask!)
  4. Develop key corporate processes and performance metrics that support both the ability of teams to work together towards the goal and their ability to measure progress towards achieving that goal.
  5. Communicate! Communicate! Communicate! It sounds simple, but it’s often left out. Don’t forget to communicate the way people need to hear it – for some it’s visual, for some it’s written, and for others it’s auditory. Do whatever works, even if it’s all three.

Do you have a structure that encourages collaboration? Tell us about it! Give us a shout via Twitter @whiteboardcons using#betterfastercheaper or email us at info@whiteboardconsulting.ca/staging.

Until next time,

Ruth.


Making Efficient Business Decisions

frankenstein-monster-the-green-terror Frankenstein Decisions

It used to drive me crazy.  Busting my buns on another PowerPoint Presentation on a new strategy/project/or idea.    I’d done my diligence . I’d told a story using some data (check out our previous blog post here). I went to dazzle them with my presentation skills and present my options and recommendation, and here’s what I started to hear:

“I like recommendation 1, with a bit of recommendation 2.”

“Can you do recommendation 2, but with recommendation 1’s budget and timelines?”

“Did you consider a hybrid option?”

As a real “doer”, this frustrated me as an employee, and I interpreted it as an inability to take a risk, or low risk tolerance on behalf of my executive leaders.  And worst of all, it wasn’t efficient use of my time, or theirs.

It’s ALIVE!

Success (including employee engagement) in organizations today is hinging more and more on the ability of leaders to optimize operations by making quality decisions quickly from a data rich environment.

As a process improvement specialist, I also aimed to ensure that my options were efficient, and these hybrid or Frankenstein options were’t the most efficient solution -much like Frankenstein himself – big, burly, and slow moving.

While the individual solutions may have been better, faster, or cheaper (or hopefully all three) – the hybrids were unattractive, difficult to put together, and didn’t yield the best results – even if they were technically feasible, or “alive”.

3 Tips to eliminating Frankenstein and Promoting Efficient Decision Making

  1. State  your case upfront. The solutions and alternatives your are recommending are standalone.  Use data to support this, but demonstrate right at the outset that it has been evaluated as an option. Or create a hybrid option to present that IS efficient.
  2. Make sure your data is accurate and timely.  Encourage to drive a data driven culture forward buy using data to build your case.
  3. Be collaborative.   Bring as many people into your story during to development, so that people aren’t tempted to make a monster mash of your hard work.

Do you have a Frankenstein experience? Give us a shout via Twitter @whiteboardcons using#betterfastercheaper or email us at info@whiteboardconsulting.ca/staging.

Until next week,

Nicole

We Go Through the Change Curve Too!

You would think that we here at Whiteboard Consulting Group, being pretty good (if we do say so ourselves) at Change Management and Transformation, would never have any trouble with change or transformation ourselves.

Not so, actually.

We recently ate a bit of crow and admitted we were a little stubborn when we refused to accept that our logo could use some sprucing up.

First, a Little History

Our website and logo were created early in 2012 by a young up-and-coming designer, and we were (and are still) thrilled with what he did for us. He designed everything from scratch, based only on our rough sketch and (sometimes flip-flopping) requests. The artwork, colours, fonts – everything was very “us” and we loved it!

As our clientele grew and our focus changed, it became clear we needed to spruce up the look and functionality of the website, and this summer we finally bit the bullet to get it done.

A Change is Gonna Do You Good

Enter Kobayashi Online and their creative team. They did an amazing job modernizing our website and adding functionality we didn’t have before. And they also updated our logo.

Here’s the old logo:

Screen Shot 2013-09-20 at 2.26.31 PM


Here’s the new one:

whiteboard-logo


You can see the new one is a little more whimsical (which is what we strive for – see Nicole’s blog here on that topic), and looks more like handwriting on a whiteboard. We absolutely love it.

At First We Hated the Idea

Our conversations with Kobayashi’s Art Director, Martin Finesilver, went something like this:

M: You should really let me take a stab at modernizing your logo.

Us: No thanks. We like our logo.

M: I could help make it fit the new site better, make it crisper…

Us: No thanks. It won’t work and we don’t need it.

M: But I…

Us: Look, if you want to try, go ahead. But we won’t like it. We like the one we have.

M: Sigh. Ok.

Fast forward a couple of months, and Kobayashi is sending us concepts. We opened the files with some dread, thinking, what have they done to our logo?

First reaction? “It’s weird.”

Second reaction? “It’s kind of interesting.”

Third reaction? (After really taking the time to look at the site and understand the new design) “It’s pretty awesome.”

The Change Curve

The point of this story is to stress that everyone goes through a series of reactions when going through a major change (or even some minor ones). The Change Curve shows us that a phase of Denial (“It won’t work”) is quickly followed by Anger (“What have they done to our logo”), and then the voice of reason kicks in and Exploration takes over (It’s kind of interesting.”) Finally, Acceptance (“It’s pretty awesome.”)

change curve

People who are generally open to change and fairly resilient can go through these phases fairly quickly, zipping right from Disbelief to Acceptance. Others may take a lot longer, and even get stuck in Disbelief or Anger.

The key is to recognize how you (or someone on your team) is handling a change, and to coach accordingly.

Disbelief –>provide information

Anger –> listen more than you talk

Exploration –> encourage and provide more information and opportunities

Acceptance –> reward and recognize

Nicole and I went through these phases relatively quickly because we are fairly resilient (and because we have absolute faith in Brent Kobayashi and his team). We also did a little bit of peer-to-peer coaching when we discussed the new logo, and that always makes things easier.

In the end, it was a great experience, and looking back it was a healthy reminder that we too, go through the change curve. Just like you.

Do you have a change curve experience? Give us a shout via Twitter@whiteboardcons using #betterfastercheaper or email us at info@whiteboardconsulting.ca/staging.

Until next week,

Ruth.

Tweets by @WhiteboardCons

Segue (or Segway) from Bad Busy to Good Busy

Welcome to our first blog on the new website!

How do you like it?  A couple of weeks ago I told you it would be a “website mullet” – whimsy in the front and corporate in the back.  If you love our website, then Click to Tweet! Many thanks to the awesome team at Kobayashi Online for their hard work and creative design – they really do make online friendly!

segue

We’re just on our way back from Chicago where we delivered a presentation on “Instilling a Process Improvement Culture Through Coaching” at the Quality Expo.

We had a blast presenting and met a great bunch of quality geeks just like us!  Everyone talked about how busy they were, and how they wanted to implement coaching as part of their quality initiatives, but it was hard because they are TOO BUSY. It made me think of a Visa advertisement that I heard last week that talked about “Good Busy” versus “Bad Busy”.  They have great examples and their pitch is “When you’re in control of your cash flow you can focus on the work you love; you know, good busy. That means making more money, being more strategic, and doing better things for your clients or customers (check it out here).  I loved it. This concept has come across the proverbial desk here at Whiteboard Worldwide Headquarters in a number of ways.

Good Busy vs. Bad Busy: What’s the difference?

The first time this concept “clicked” for me was in Tim Ferriss’ The 4 Hour Workweek.  He highlights how so many of us spend all day reading and responding to emails, instead of working on the big strategic objectives that give us value in an organization.  Why? Because responding to emails is easy, and instantly satisfying. Doing the big work is hard. If you want to change, however, you can’t keep doing what you’ve always done!

That segues to one of our clients, who said one of my favourite phrases of all time (and which we have since mentioned often in our blog): “I’m addicted to firefighting”.  I thought this was brilliant.  He was addicted to the drama, addicted to high speed reactionary problem solving. Organizations love to create and resolve these “problems” every day. It feels good to solve a problem. It provides instant satisfaction. It has instant results and outcomes. It’s so much more fun than discovering and building a relationship with a new (or old) team member, giving constructive feedback, or having a difficult (yet important) conversation on performance of a team member. Those things are hard and unpleasant, but are so necessary to achieve something like operational excellence.

So which is which?

 Good Busy

Value added activities (anything that adds value to your customer)

  • Interacting and meeting with clients
  • Production of your product or delivery of your service
  • Work for client paying activities (ie. Deliverables for a client)
  • Selling your product to your customer

Bad Busy

Non-value added activities (i.e. internal administration)

  • Internal email administration
  • Payroll
  • Doing quality control on your product
  • Time spent on advertising
  • Time spent on shipping of raw materials to produce your produce

DISCLAIMER:  Sometimes using value added vs. non-value added makes people say – well “Payroll IS value added?  How would I run my business”. Don’t get tied up in the semantics. Rule of thumb for identifying non-value added steps: any activity that doesn’t improve the form, fit or function of the product. Think of things like inspection, testing, re-work, set-up, movement of product (if it’s not direct to the client), etc

Tips to get “Good Busy”

We’re going to sound like a broken record, we’re sure you’ve heard them before – but practice makes perfect:

  1. Make a list. Number your activities based on priorities 1,2, and 3 (#1s Must get done today, #2s should get done, #3s can be rolled over to a subsequent day).  Start on your #1s (I guarantee they aren’t your favourites, you’ll be dying to do a#3)
  2. Tame the email beast. Turn off your email notifier AND set specific times a day to check and respond to email (doing email can be a reward for checking off a #1 from your list above).
  3. Improve your processes.  Are there bottlenecks? Do you have multiple approvals that don’t add value? Are there internal forms and paperwork that could be streamlined? What are you or your team doing that is making things BUSY without adding value?

The key is to  focus your day on what makes your company or organization money and what adds value to your clients.  You and “Bob from Accounting” having a CYA machine gun email tete-a-tete does neither of the above (no matter how fun it may be to prove that you did in fact email him on October 2nd asking  that expense claim question).  To paraphrase that tagline from Visa, remember: “When you’re in control of your processes you can focus on the work you love, you know, good busy.” Click to Tweet

Have ideas about Good Busy and Bad Busy?  I’m sure Visa @VisaBiz_CA wants to hear them since it’s their ad campaign – so use the hashtag #goodbusy. And if you heard it first from us, tweet us too @whiteboardcons #betterfastercheaper.

Have a happy and productive week!

Nicole

Perfuncta What?

Operational Definitions: Not a Perfunctory Exercise

We have a colleague whose favourite words these days is “perfunctory”, and he uses it frequently enough that I looked up the definition just to be sure I knew what it meant.

per-func-to-ry adjective \pər-ˈfəŋ(k)-t(ə-)rē\

  1. characterized by routine or superficiality
  2. lacking in interest or enthusiasm

That little exercise reminded me of how important it is to have common definitions at work. Never mind the embarassment of using a word incorrectly, which we’ve all done on occasion. (Well I have, anyway…) It’s about speaking the same language in the office, and avoiding any potential for misinterpretation and mistake.

My Definition is This (Bonus earworm for those who know that tune, for those who don’t, click here )

One of the things we are working on right now is a review of a PMO (Project Management Office) function in a large public sector organization. As part of any review, we conduct a number of interviews with various employees at all levels of the organization. And, as always, we find that people are working with differing levels of understanding of key operational terms, and that this is creating some confusion with respect to roles, responsibilities, and key outcomes.

Here’s a good example: what does performance management mean to you? Is it related to the work output and behaviours of an individual employee, and the ability of a manager to influence it positively?

No? Oh, well perhaps you feel it’s the use of key performance indicators to ensure that an organization meets its goals and targets in a timely manner.

Wait, what? You think it’s both?

If you look it up, even Wikipedia gives several definitions:

Performance management (PM) includes activities which ensure that goals are consistently being met in an effective and efficient manner. Performance management can focus on the performance of an organization, a department, employee, or even the processes to build a product of service, as well as many other areas.
PM is also known as a process by which organizations align their resources, systems and employees to strategic objectives and priorities.
Performance management as referenced on this page in a broad term coined by Dr. Aubrey Daniels in the late 1970s to describe a technology (i.e. science imbedded in applications methods) for managing both behavior and results, two critical elements of what is known as performance.

If you’re working on a culture shift in your organization, then a great exercise involves getting groups of people together in a room and having work in small groups to define key terms. For instance, for a PMO conversation, you might have people define: Project, Charter, Project Manager, Process Owner, Project Sponsor, Communication Plan, Risk Mitigation Plan, etc. Here’s the trick: there’s usually no right answer. Just pick the one that works for most people, and stick with it! If everyone is speaking the same language, you’ll save so much confusion and time.

And there’s nothing perfunctory about that.

Give us a shout via Twitter @whiteboardcons using #betterfastercheaper or email us at info@whiteboardconsulting.ca/staging.

Tweets by @WhiteboardCons

Until next week,
Ruth.

« Previous PageNext Page »